CASE STUDY
We multiplied x3 the productivity in the creation of e-learning courses at Vodafone

Author
The #1 AI-powered authoring tool on the market

Factory
Custom e-learning content factory

Skills
Comprehensive power skills course catalog

LMS
All-in-one LMS platform with AI

Engage
App for managing frontline teams

Game
Gamification app for business
FEATURES

AINew
Unlock your full potential and speed up course creation with artificial intelligence.
Accessibility
Automatically meet accessibility guidelines—without sacrificing interactivity!

Interactivity
Boost engagement with interactive, ready-to-use activities that make learning fun.

Course Creation
Reduce the time it takes to create your e-learning courses with our authoring tool.

Distribution
We offer you different distribution options, so that nothing can stop you.

SCORM
Publish your course in SCORM format and share it on any LMS.
SERVICES

Instrucional Design
Surprise your students with multimedia and interactive content.

Custom Courses
We create e-learning courses for you—tailored to your needs and hassle-free!

Virtual Reality
Turn learning into an immersive experience.

Custom Avatars
Give your courses and videos a unique touch with personalized avatars.

Audiovisual FactoryNew
Turn training into something dynamic and visual with engaging videos.
CATALOG
Course catalog
Over 600 skills and competency courses to help you adapt to your team's needs.

Microsoft Copilot AcademyNew
Your professionals will learn how to apply Copilot AI to key processes within your organization.
Artificial Intelligence Academy
Train your teams in the practical use of AI to boost productivity and innovation in your company.

Cybersecurity Academy
Capacita a tu empresa con el catálogo más completo en seguridad digital corporativa.
FEATURES

Quizzes & Games
Turn your training into an engaging Q&A game.

Challenges & Competitions
Enhance learning through friendly peer challenges.
Rewards & Incentives
Motivate employees with points, levels, and leaderboards.
Social & Collaborative
Strengthen team connections with interactive social dynamics.

KPIs & Analytics
Track and optimize your training initiatives instantly and effortlessly.

Use cases
Choose the solution that best fits your needs

Industries
Solutions for all types of industries
USE CASES
Onboarding
Facilitate the onboarding process, productivity and engagement of your new employees.
Upskilling
Boost your team's skills and prepare them for the challenges of the future with upskilling.
Microlearning
Discover all the advantages of microlearning and boost your training results.
Gamification
Enjoy addictive training that will get your professionals hooked.

Internal Communication
Improve communication in your company and enjoy an aligned and committed team.

Mobile learning
Agile, flexible, and interactive learning—built for today’s digital-first workforce.
INDUSTRIES

Banking and financial services
Training in compliance, cybersecurity, customer service, and key skills development.

Pharmaceuticals and healthcare
Digital onboarding, regulatory updates, and ongoing training for healthcare staff.

Retail and consumer
Agile and scalable training for in-store, operational, and customer service teams.

Industry and manufacturing
Training in processes, safety, and corporate culture for distributed teams.

Education and training
Digital solutions for training centers, internal academies, and corporate universities.

Technology and telecommunications
Development of technical talent, digital skills, and upskilling and reskilling programs.
CLIENTS

MAPFRE
How MAPFRE turn e-learning into sales with isEazy

Pepco
A personalised learning experience for a growing team.

BBVA
Digitisation and creation of high quality e-learning content.

Shiseido
We increase the engagement of the training with a social and gamified app.

Telefónica
Large-scale reskilling for the company's digital transformation.
Vodafone
A personalised learning experience for a growing team.
More than 1,000 companies already rely on isEazy.


MEET ISEAZY

News
Find out the latest news about isEazy: press releases, partnerships, updates...

Contact
Leave us your personal details and we will contact you as soon as possible.
About isEazyNew
Find out more about our company.
Careers
We are looking for the best talent, join our team!

Partners
Become our partner and grow your business.
INTERESTING RESOURCES

Blog
The best content on e-learning: trends, tools and key strategies.
Whitepapers
Gain valuable insights and stay ahead of industry trends.
Product releases
The latest news and releases of our e-learning products and solutions.

Glossary
Definitions of the most commonly used terms and key industry concepts.
Guides
Discover the best step-by-step tips and tricks to optimize your L&D strategy.
Webinars
Video sessions on our products, trends and more

Comparatives
Compare e-learning solutions available on the market and choose the most suitable one.

April 13, 2026
CONTENT CREATED BY:
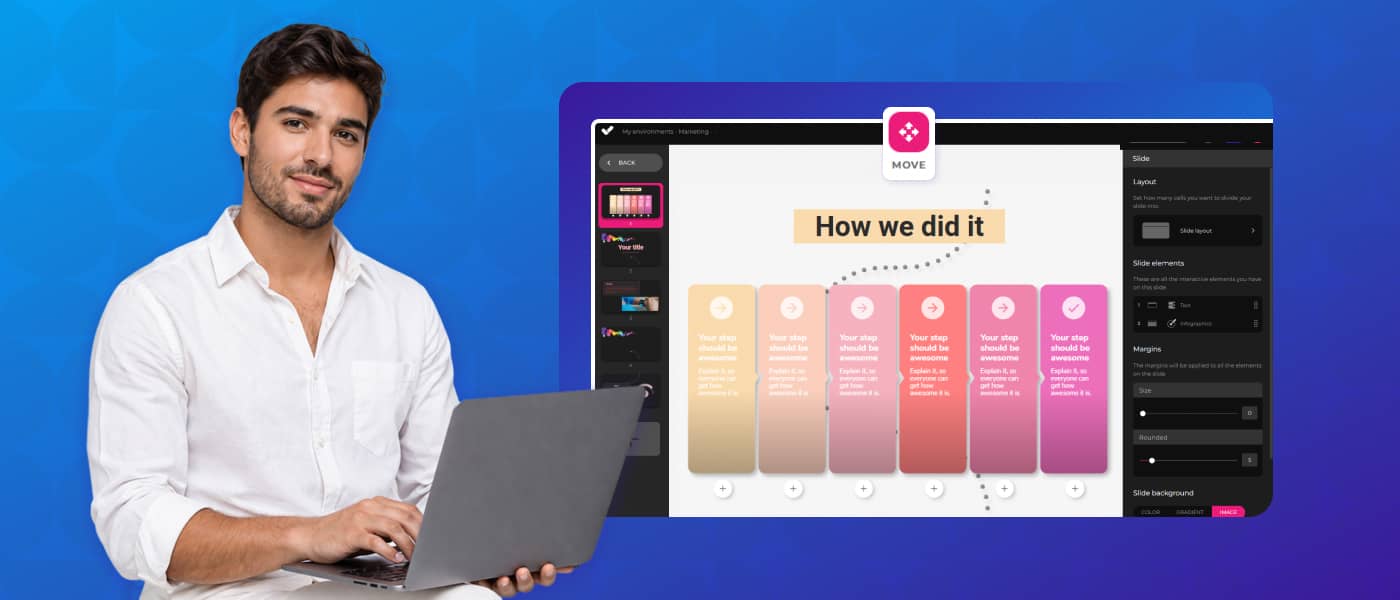
Table of contents
An interactive infographic is a visual resource that allows users to actively explore the information presented: expanding sections, zooming in on text, navigating through layers, or interacting with its elements. Unlike a static infographic, it does not simply display data — it invites users to discover it.
In the context of corporate training, this type of resource is especially valuable for representing multi-step processes, comparisons between concepts, hierarchical structures, or any content where understanding improves when learners control the pace and level of detail they access. According to the Learning and Development Global Sentiment Survey by Donald H. Taylor, interactive and personalised content is among the top priorities for L&D teams in the coming years.
Interactive infographics are not simply an aesthetic upgrade to content: they have a direct impact on how learners process and retain information. Here are their main advantages in the e-learning context:
Not all interactive infographics are the same. Choosing the right type depends on the nature of the content and the learning objective. Below are some of the formats available in isEazy Author and their optimal use cases in corporate training:
In all types, automatic numbering can be enabled or disabled as appropriate: it is especially useful when the order of elements is significant (steps in a process) and unnecessary when elements are equivalent to each other (values, categories).
| Type | Best for | Recommended no. of elements |
|---|---|---|
| Pyramid | Hierarchies, levels, priorities | 3–6 |
| Sectors | Proportions, categories, distribution | 3–6 |
| Horizontal panels | Linear processes, sequential steps | 3–6 |
| Vertical panels | Comparisons, parallel concepts | 3–6 |
isEazy Author includes the Infographic element natively, with no need for external tools or design knowledge. The creation process follows these steps:
Select from pyramid, sectors, horizontal panels or vertical panels. You can change the type at any time without losing the content already entered: the system automatically adapts the visual representation.
The title appears above the infographic. If the element occupies a small space within the slide, the title is hidden and appears as a pop-up button to avoid compromising the visual space.
You can use a solid colour (with adjustable opacity) or a background image. This setting is the same as for other visual elements in Author, so if you are already familiar with the image element you will not need to learn anything new.
Automatic numbering is useful when elements have a significant order. If elements are equivalent or interchangeable, disable it for a cleaner appearance.
Each infographic element has four configurable fields:
The extended text is additional content that appears when the learner presses the “+” button on each element. It is ideal for training where learners need to access supplementary information without cluttering the main view. In courses with sequential navigation, the system can require learners to have viewed this text before advancing, ensuring they do not skip critical content.
Vodafone is a good example of how an authoring tool with native interactive elements such as infographics can transform the production of training content. With isEazy Author, Vodafone tripled its productivity in e-learning course creation, producing more engaging and interactive content in less time. Discover how they did it →
CASE STUDY
We multiplied x3 the productivity in the creation of e-learning courses at Vodafone


The market offers different solutions for creating interactive infographics, from generic design tools to e-learning-specific platforms. The key difference lies in whether the tool is designed to produce training content or simply visual content:
The following comparison shows the main differences between isEazy Author and other market options for creating interactive content:

Features
Advantages
Pricing
Features
Advantages
Pricing

Features
Advantages
Pricing
Features
Advantages
Pricing
Funcionalidades
Ventajas
Precios
Precios personalizables
Funcionalidades
Ventajas
Precios
Precios personalizables
An accessible interactive infographic is not an optional goal: it is a requirement to ensure that all staff can complete training on equal terms. Here are the fundamental best practices:
Designing with accessibility from the outset not only meets current legal standards: it improves the experience for all learners and reinforces the organisation’s commitment to diversity and inclusion.
Knowing the most common mistakes helps avoid them before they affect the learner experience:
Interactive infographics are much more than an attractive visual resource: they are a pedagogical tool that improves retention, reduces cognitive overload and turns learners into the protagonists of their own learning. In a corporate training context where time is limited and attention is the most valuable asset, choosing formats that invite exploration rather than simply displaying information makes all the difference.
With isEazy Author, creating professional-quality interactive infographics requires no design knowledge or external tools. Everything is natively integrated in the same environment where you build your courses, with the same logic, the same tracking and the same accessibility standards as the rest of your content.
Want to see it for yourself? Try isEazy Author for free and discover how easy it is to transform your content into learning experiences that truly engage.
A static infographic is a fixed image that represents data or information visually, but without any possibility of interaction. An interactive infographic, on the other hand, allows users to actively explore the content: expanding sections, zooming in on text, clicking on elements, or navigating through layers of information. In the context of e-learning, this difference is critical: interactivity increases attention time, promotes information retention, and turns the learner into an active participant in the learning process rather than a passive recipient.
The standard recommendation is to work with a minimum of 3 and a maximum of 6 elements per infographic. With fewer than 3, the visual representation doesn’t justify using an interactive element over conventional text. With more than 6, the infographic can become dense and difficult to process, especially on mobile devices. Each element should have a clear title, a descriptive text, and optionally a representative icon and extended text for learners who want to go deeper. The key is that each element represents a distinct concept, not a variation of the same idea.
Interactive infographics are especially effective for content where logical or hierarchical structure matters: ordered-step processes (where the pyramid or numbered panels help follow the sequence), comparisons between options or categories (where sectors allow visualising proportions), and concepts with multiple related components (where horizontal or vertical panels facilitate exploration). They are less recommended for purely narrative content or when the number of elements is fewer than three, as in those cases a rich text block can be equally effective.
Yes, provided they are designed following accessibility best practices. The main recommendations include: using colours with sufficient contrast (minimum ratio of 4.5:1 for normal text according to WCAG 2.1), assigning a semantic heading to the title so screen readers can identify the element, and enabling accessible mode if the tool offers it. In accessible mode, the extended texts that are normally shown on interaction appear directly alongside the legend, ensuring that users with visual or motor disabilities can access all the information without relying on interaction. Additionally, in courses with sequential navigation, the system can require learners to have viewed the extended text before advancing.
Create personalized e-learning courses for every learning style with interactive elements like videos, exercises, games, and graphs
Try it freeRequest a demo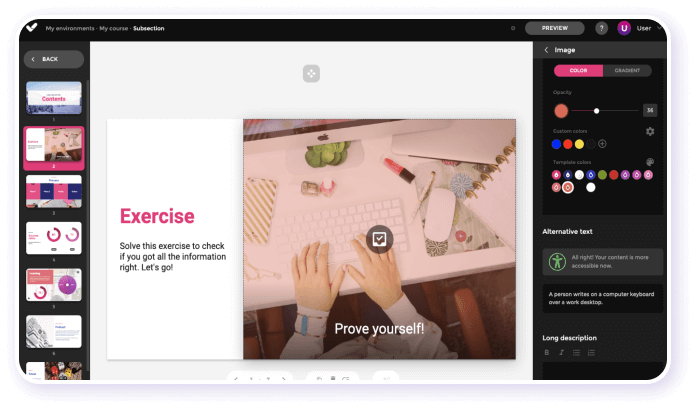
Looking for an easy, agile and efficient authoring tool?
Create accessible, engaging and dynamic e-learning courses with artificial intelligence in minutes.

Looking for an easy, agile and efficient authoring tool?
Create accessible, engaging and dynamic e-learning courses with artificial intelligence in minutes.